Showing posts with label Protein Science. Show all posts

Friday, 3 October 2014

Resins & Protein Binding Capacities

Compare & Contrast 
When choosing what resin to use for purifying a protein, one of the most important characteristics to look at is protein binding capacity.  Protein binding capacity is a critical parameter for chromatography media because it determines how much media is needed in order to purify a certain amount of protein. 
This in term determines the column size needed, flow-rates of your chromatography system, and ultimately the total costs for purifying your protein. But, can capacity data reported from different vendors always be directly compared?

The short answer is "No" and in this post we will try to explain what protein binding capacity is, how it can be measured, and what to look out for when looking at your vendor’s specification sheets.

Firstly, the resin capacity for different proteins is often specified by suppliers based on

  • different modes of measurements (dynamic or static)
  • experimental conditions (pH, salt/conductivity, protein concentration)
  • reference (capacity per milliliter wet resin or g dry resin)
Naturally, what protein has been used to determine the binding capacity is vital information in order to be able to compare specs. Unfortunately, in many cases, the method for determination of the binding capacity is not stated.
This makes it very difficult to compare the resins based on tabular values from the vendors.

What are the differences between static and dynamic capacity?
The static binding capacity (SBC, also called total protein capacity) is normally measured in batch mode in a beaker and is usually referred to as the maximum amount of protein bound to a chromatography medium at given solvent and protein concentration conditions. The size of SBC   varies significantly depending on the protein loaded. In these experiments, an excess of protein is loaded to give a maximum binding capacity. Protein loss is often over 50 %.

Dynamic binding capacity (DBC), on the other hand, is the binding capacity under operating conditions (i.e. in the packed affinity chromatography column during the sample application and washing procedures). The DBC of a chromatography medium is the amount of target protein that binds to the medium  under given flow conditions before a significant breakthrough of unbound protein occurs.
DBC is determined by loading a sample containing a known concentration of the target protein. The load of the protein sample on the column is monitored and will bind to the medium to a certain break point before unbound protein will flow through the column. From the breakthrough curve (see fig.1) at a loss of for example 10 % protein (named QB10),  the DBC is found and the experiment is stopped. As this parameter reflects the impact of mass transfer limitations that may occur as flow rate is increased, it is much more useful in predicting real process performance than a simple determination of saturated or static capacity.


In most instruction manuals from GE Healthcare, you can find information on the DBC and how it has been determined.

How does GE determine its resin binding capacity?
GE Healthcare uses the DBC as the measurement for media packed in columns since it takes the flow rate and bed height of the column into consideration. It also takes into account ligand density, size of protein, and the porosity of the media which are the only factors included in the measurement of SBC.
SBC can be used to determine the binding/total capacity of bulk media.
However, as DBC is measured under operating conditions you will also get information on what the maximum load of your target protein to your column should be in order to avoid unnecessary loss.


If you have any questions please ask away via the comments section or for more detail check out our Protein Skills Handbook which covers this and many other aspects of protein science

Monday, 8 September 2014

A Swift Introduction to Electrophoresis


Electrophoresis is a very common technology used in many different types of protein analysis, no matter if the protein of interest is purified or part of a complex sample. When optimizing conditions for expression of recombinant proteins, electrophoresis can be used to obtain information about protein yield at various conditions. Additionally electrophoresis can be used subsequently to purification by gel filtration, to verify protein purity and to confirm that the purified protein has correct molecular weight.

Electrophoresis of proteins is usually carried out by loading a sample into a well, to which a voltage is then applied; the varying size, shape and charge of molecules makes them move through the matrix at different velocities. At the end of the separation, the proteins are detectable as bands at different positions in the matrix.

Gel electrophoresis, as a means to separate proteins, is usually performed under denaturing conditions imparted by the presence of the detergent, SDS, both in the sample and as a constituent of the gel and running buffer. 1.4 g of SDS will bind to each gram of protein, so that any inherent charge on the protein is masked by the coating of negatively charged detergent micelles. Denaturing gels can be run under reducing conditions, where a reducing agent such as dithiothreitol (DTT) or β-mercaptoethanol is added to the sample buffer and heated. These reagents act by cleaving disulfide bonds between cysteine residues to disrupt the quaternary and tertiary structure of the proteins, creating linear chains of polypeptides. Proteins treated in this way migrate at rates that are a linear function of the logarithm of their molecular weights.

Alternatively, denaturing gels can be run under non-reducing conditions (no sample boiling and no added reducing agent) when it is important to maintain the native structure of proteins for further analysis.

Polyacrylamide gels, both as homogenous and as gradient, are the most commonly used matrices in for separation of proteins. In a complex sample where separation is desired over a wide range of molecular weights, a gradient gel with increasing gel density should be used. In such a gel, over a given time, small proteins will reach dense regions of the gel while larger proteins will migrate within less dense regions.


Hopefully that brief of electrophoresis was helpful but for more detail and information on its use please download our free handbook guide to protein purification or ask a question via the comments section below. Thanks for reading 

Friday, 27 June 2014

How to Select the Analysis Methods for Your Protein Project

Proteins can be analysed in a multitude of ways using a plethora of techniques. When it comes to protein purification, there are certain pieces of information about your protein that you are always interested in collecting. Any other aspects you may need to measure are decided by the nature of your research project.

For protein purification, the key pieces of information are identity, purity, size homogeneity, activity and concentration of your target protein (it is also worth trying to get some information about any key impurities as well).

Determining protein purity
Without doubt, the most common technique for determining protein purity is denaturing gel electrophoresis by sodium dodecyl sulfate polyacrylamide gel electrophoresis (SDS-PAGE). This technique separates proteins by size and allows various detection techniques to be used. Classic methods include Coomassie and silver staining, but more and more pre-labeling using a fluorescent dye is gaining in popularity. The classic staining methods use photographic detection using CCD digital imagers (or film if you're lab is old school :) which are robust but less sensitive and quantitative compared to fluorescent pre-labelling.

Alternatives to SDS-PAGE for purity analysis include 2-D PAGE, size exclusion chromatography, and mass spectrometry (Matrix-assisted laser desorption/ionization; MALDI-MS).

Measuring protein identity
The most common technique used for protein identity is western blotting. Western blotting uses denaturing SDS-PAGE gel electrophoresis followed by transfer of the separated proteins to a membrane. These proteins are then detected by a specific antibody and a secondary functionalized antibody which enables detection by chemiluminescence or fluorescence.
Mass spectrometry in combination with reverse phase chromatography, can provide an easy and fast complement or alternative to the antibody-based detection step in western blotting. The main drawback is that you need to have access to a mass spectrometer, a significant piece of kit and often a shared service. The main principle for confirming protein identity using mass-spectrometry is to trypsinate the SDS-PAGE gel band of interest prior to mass analysis. To identify the peptides, Electrospray Ionization (ESI) connected on-line with reverse phase chromatography is common. The mass-spectrum of peptide species after trypsinization provides a unique fingerprint for most proteins, which can be identified using a database lookup.

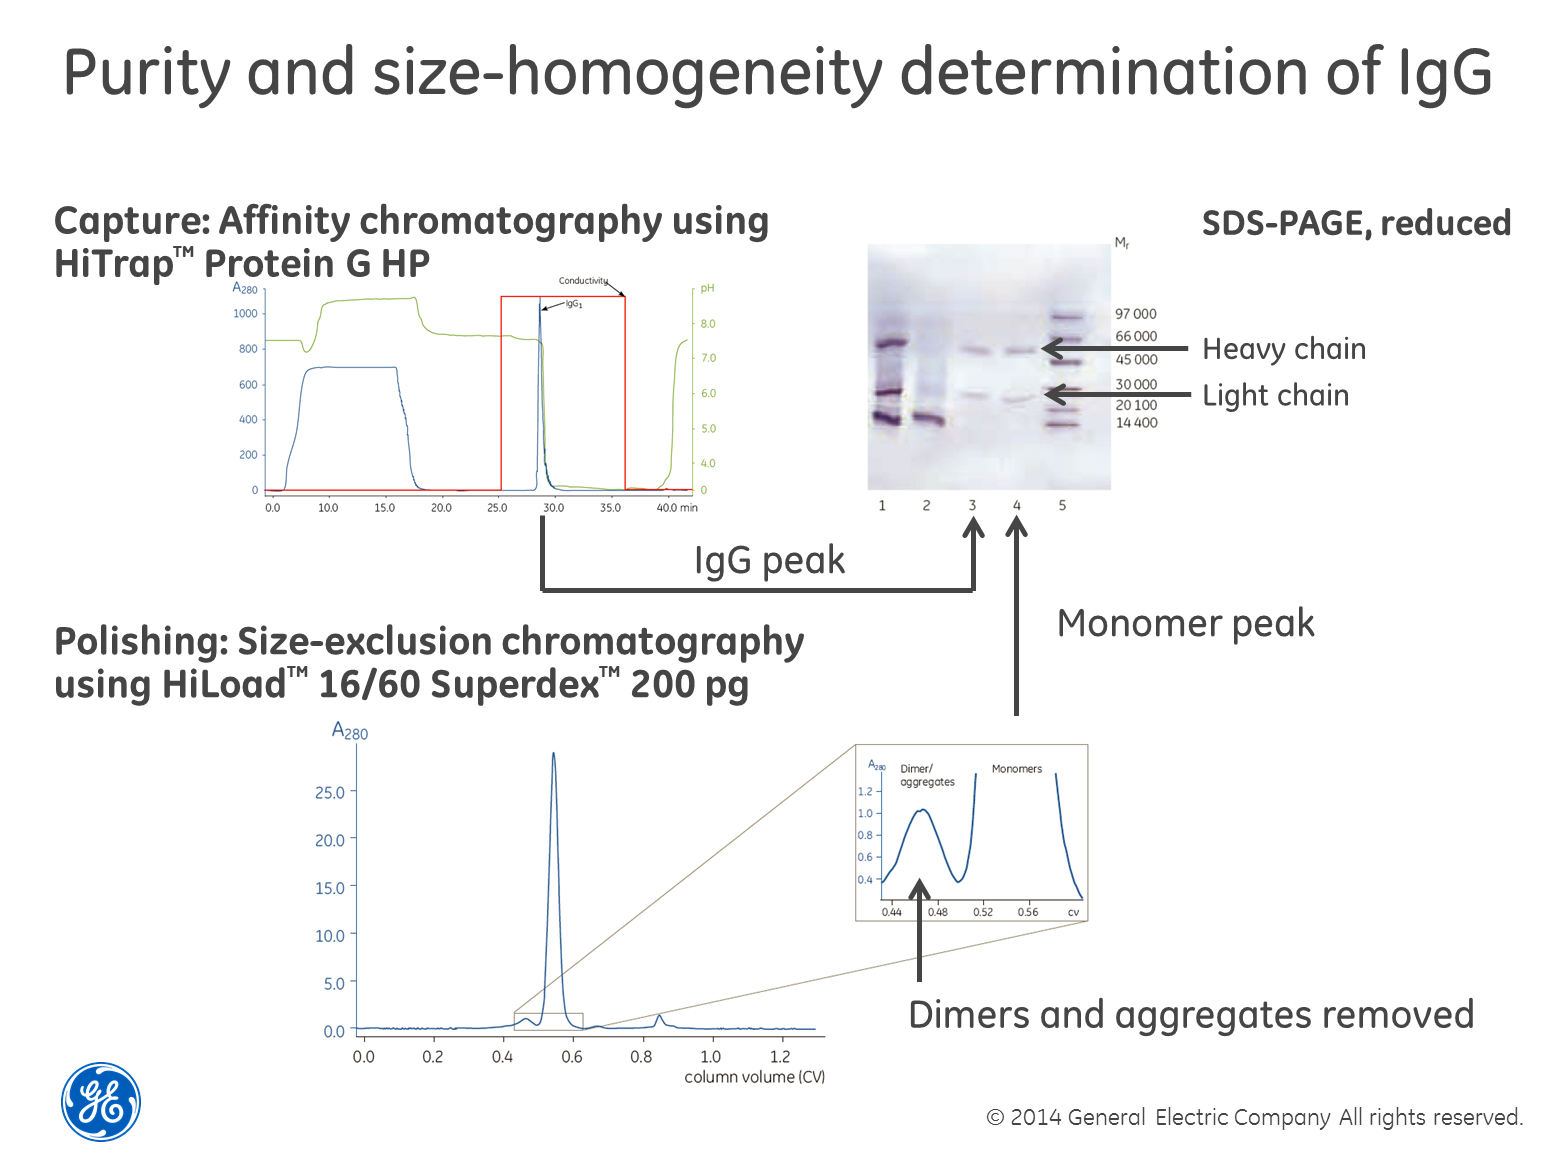
Use SEC in combination with SDS-PAGE for size homogeneity


Perhaps the most robust and powerful way of determining size homogeneity is to first separate your sample using size-exclusion chromatography (SEC), collect the fractions and then run a SDS-PAGE gel containing reducing agents such as dithiothreitol (DTT) on the fractions. The reducing agent breaks di-sulfide bridges between cysteine residues and the gel shows single-chain sub-units of the different sizes, if cysteins are causing multimerization. The textbook example is the combined purification and analysis of IgG as exemplified in the image above. The only drawback we can think of with this method is that if you have a low concentration of the protein in your sample, it may be difficult to detect. You also need to choose a SEC column with the right separation range for your protein of course.
Alternatives to this approach include using light-scattering or mass-spectrometry after the SEC step. Again, these detection techniques involve investment in expensive instruments.

Estimating concentration
As the subhead suggests, we think regardless of what measurement technique you use, you are likely to end up with nothing more than an estimation of the concentration. That said, measuring concentration is a chapter of its own (something we’re going to discuss in detail in future posts) but unfortunately no protein concentration assay method exists that is either specific to proteins or uniformly sensitive to all protein types (i.e. not affected by differences in protein composition). It is therefore important to choose the method that is most compatible with the sample and will give enough information for you to move forward with you research. 
For example, one of the most common methods when you want to check the expression level of you target protein from cultivation is to do a rough estimation with SDS-PAGE; it will show if you are on track. If you want to measure the total protein concentration the tried and tested methods are the Coomassie (Bradford) protein assay, BCA protein assay (also known as Smith assay) and UV absorbance at 280nm. 

Each of these methods has its own set of advantages and disadvantages. However, these methods give only an estimation of the total protein concentration. Because no method can be considered the ideal assay method for all circumstances, most researchers have more than one type of protein assay available in their laboratories. The BCA Protein Assay and Bradford Protein Assay methods are complementary and cover most samples, with both based on detection of color change. BCA is a two-step protocol including a Protein-copper chelation and secondary detection of the reduced copper. Bradford is a protein-dye binding and direct detection of the color change associated with the bound dye.

When choosing an assay somethings to consider:

•Compatibility with the sample type and components (e.g. in lysis buffer) that may interfere with the protein and/or the reagents in the assay used

•The concentration range of the assay and required sample volume. For example the Bradford assay works in a concentration range of 125–1,000 μg BSA /ml and the BCA assay in a working range of 20-2000μg BSA/ml

• Protein compositional differences which end up in different amount of color in the final solution and may give wrong concentrations- choose assay and protein standard which will minimise this error

•Speed and convenience for the number of samples to be tested

•Availability of spectrophotometer or plate reader

If your protein is an enzyme with activity in a specific enzymatic assay, using an assay may be an easy way to find out where in your eluted purification fractions the target protein is. You will then be able to detect your protein through all purification steps and have full control of the design of the purification protocol and quality of the obtained preparation. The activity is also an insurance that the protein is obtained in its native state.

We will go through the methods described in upcoming posts when we delve into our DHFR project. 

In the meantime, thanks for reading and if you have any questions let us know via the comments section below.